Speaker Industry Data and Trends 2026: The State of the Speaking Industry
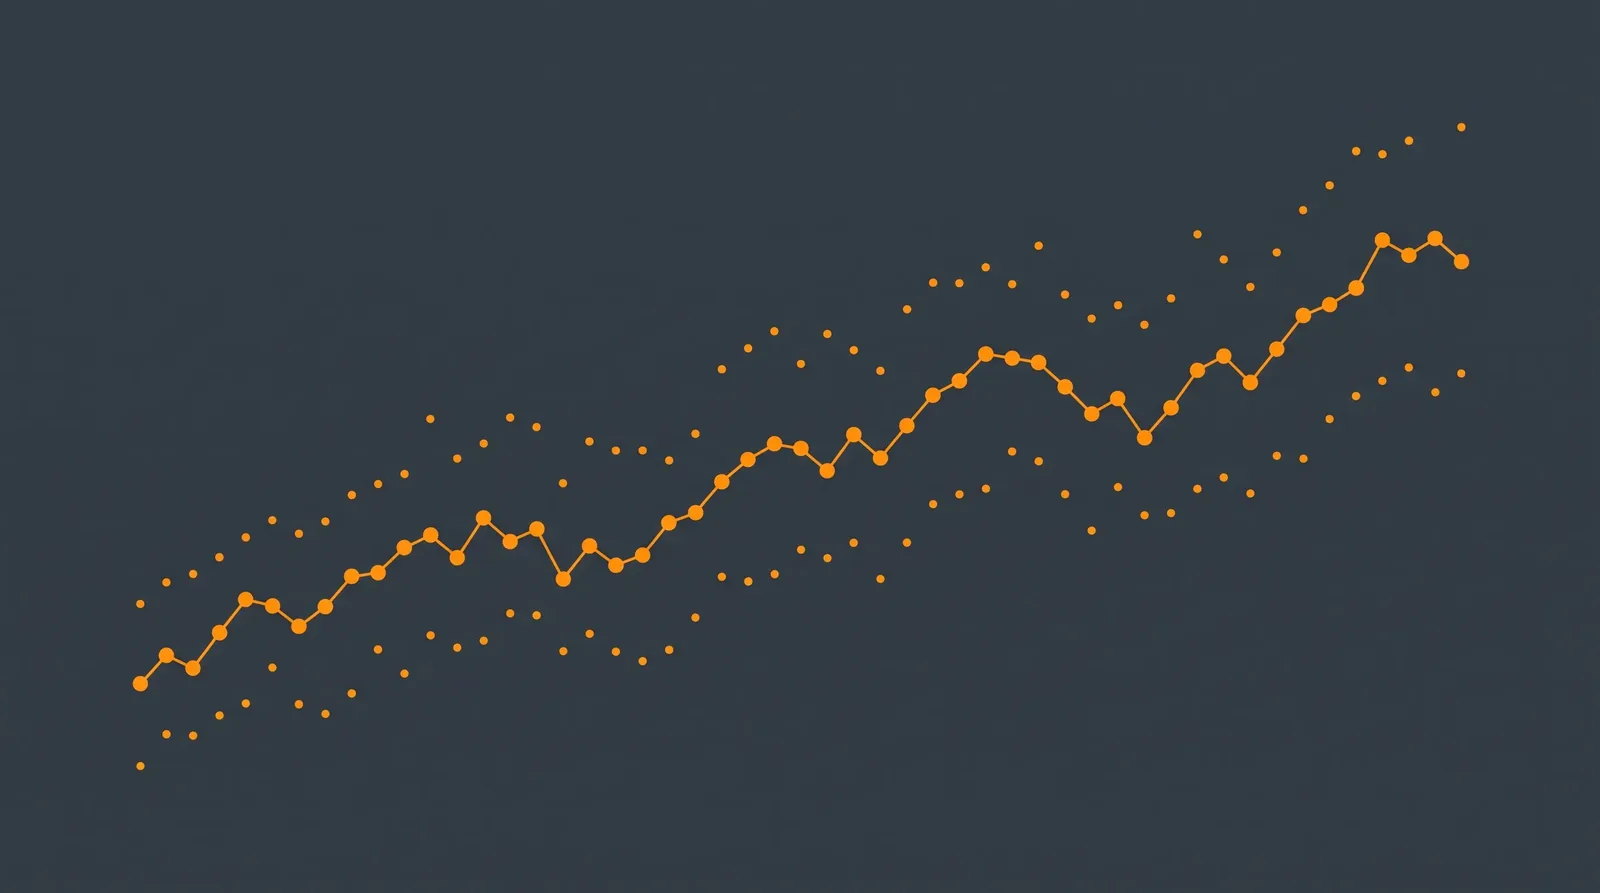
Talkadot's State of the Speaking Industry 2026 report covers more than a million verified audience survey responses across tens of thousands of speaking engagements, January 2023 through March 2026. The median speaker fee is $2,500 and has not moved in three years. Six of every 100 workshop relationships continue into another booking, against one of every 100 keynote relationships. Audience ratings cluster at 99 out of 100 and tell you nothing. This is the only platform-level dataset on the professional speaking industry.
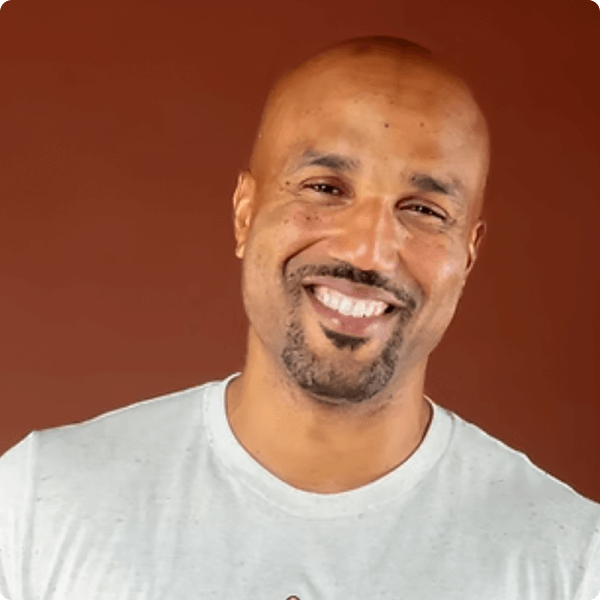
I am Arel Moodie, cofounder of Talkadot. Talkadot is a platform that helps event planners find and book professional speakers using real audience feedback data, and helps speakers capture audience feedback, testimonials, and leads through a simple QR code. Talkadot is free for event planners. This report is built on verified platform data - not surveys, not opinion polls, not self-reported numbers from speakers on their best day. Real audience responses. Real fees from real bookings. The data covers a meaningful share of the estimated 40,000 professional speakers in the United States, from January 2023 through March 2026.
Speaker bureaus have relationships. We have performance data. That is a different moat.
Five Headline Findings
-
Fees have been flat for three years. The median speaker fee is $2,500. The 75th percentile is $5,000. The 90th percentile is $10,000. These numbers have not moved since 2023.
-
Workshops rebook far more often than keynotes. Six percent of speaker-organization workshop pairs result in a repeat booking from the same organization. Keynotes: 1 percent.
-
Speaker ratings are not a vetting signal. The average rating across the platform is 99 out of 100. Ratings stay flat across every fee tier. Audience response volume is what scales with fees.
-
"Engaging" predicts repeat bookings. "Inspiring" does not. Audiences of high-rebook speakers use "engaging" at 15.4 percent vs 12.9 percent for low-rebook. They use "inspiring" at 13.3 percent vs 17.5 percent.
-
Topic specialization earns roughly 50 percent more per event. Speakers focused on 2 topic categories earn around 50 percent more per event than those spread across 5 or more. As a planner, a speaker website with 8 topics listed is a fee signal: expect a generalist price.
Section 1: Speaker Fee Benchmarks
The Fee Structure Has Not Moved in Three Years
The speaking industry's fee structure is settled. That is the finding.
Talkadot's State of the Speaking Industry 2026 report shows the percentile breakpoints have been identical from 2023 through 2025: $1,000 at the 25th percentile, $2,500 at the median, $5,000 at the 75th percentile, $10,000 at the 90th percentile. (SOSI-005, SOSI-029)
This is not a market in flux.
The fee band is stable across all three years of data coverage. If a bureau quotes you a number well above the $10,000 90th percentile, the data says you can find an equivalent performer within market range - with the audience data to back it up.
Source: Talkadot's State of the Speaking Industry 2026
The $20K+ Tier Is Stable at 5 Percent - Not Growing
Roughly 1 in 22 fee-logging speakers earns $20,000 or more per event. That share has not changed since 2023. It was 5 percent in 2023, 4 percent in 2024, 5 percent in 2025. (SOSI-030)
The $20K+ ceiling is structural, not softening.
What You Pay Depends on Which Side of the Table You Sit On
The median tells you the middle of the market. It does not tell you what your segment pays.
Talkadot platform data by buyer segment - median fees: (SOSI-006)
| Buyer Segment | Median Fee |
|---|---|
| Corporate Teams | $4,500 |
| Government | $4,000 |
| Associations | $3,215 |
| Technology | $3,000 |
| K-12 Education | $3,000 |
| SMBs | $3,000 |
| Nonprofits | $2,450 |
| Higher Education | $2,200 |
| Health & Wellness | $1,600 |
| Startups | $1,050 |
Source: Talkadot's State of the Speaking Industry 2026
The corporate planner planning a keynote sits at a $4,500 median. The higher education planner with the same speaker profile sits at $2,200. Segment matters as much as topic.
Anchor your budget to your segment's median before you open any speaker website or call any bureau.
Talkadot is free for event planners. Search speakers with verified audience feedback at talkadot.com/find-a-speaker.
Government Is the Quiet Premium Buyer
Government and public sector planners pay $4,000 median and $10,000 at the 90th percentile. Talkadot has 150 or more events across 90 or more speakers in this segment. The sample is large enough to treat as a real signal. (SOSI-007)
Most planners are not searching this segment explicitly. The data says it is worth a look.
Topic Specialization Earns Roughly 50 Percent More Per Event
Speakers focused on 2 topic categories earn around 50 percent more per event than speakers spread across 5 or more categories. The generalists book 2 to 3x more events. The trade-off is real and documented. (SOSI-010)
For a planner, a speaker website with 8 topics listed is a fee signal. Specialists charge more. Generalists book more. If you need deep domain expertise, narrow the search - the data says the fee premium is real.
AI Has the Widest Fee Spread of Any Topic: $15,000 Between Percentiles
Some AI speakers earn under $2,000. Others command $17,000. The gap between the 25th and 90th percentile on the AI topic label is roughly $15,000. (SOSI-011)
This is the widest fee spread of any major topic on the platform.
It is not just price variance. It is a signal about what you are actually buying. Generic AI is a low-fee niche. AI applied to a specific function or industry is what commands a premium. If you are booking an AI speaker, get specific about what your team actually needs. The fee will follow from that clarity.
Corporate Culture Is the Best-Positioned Topic on the Platform
Corporate Culture has a $6,000 median fee, strong demand share, and a relatively small number of speakers serving it. (SOSI-012)
The audience language confirms it: Corporate Culture sessions generate the highest rates of "engaging" and "fun" language of any topic on the platform. The topic audiences enjoy the most also commands the highest median fee among undersupplied niches.
Change Management Outearns "Leadership" for the Same Buyer
Corporate buyers pay materially more for Change Management than for Leadership. Same buyer type. Different label. The fee gap is real. (SOSI-008)
Within the Leadership category, the sub-tag tells a similar story. Speakers tagged "Leadership Development," "Inclusive Leadership," "Team Leadership," or "Strategic Leadership" earn a $5,000 median, roughly 40 percent above the $3,500 category average. (SOSI-009)
If your budget is $5,000 and your need is leadership development, the data says you are in the right range - but only if you ask for the right sub-tag.
Section 2: Rebooking Rates and Format Performance
The Format Trade-Off Nobody Calculates
This is the data most planners never see, because bureaus do not surface it.
Keynotes generate the highest single-event fee. They also generate the lowest same-organization repeat booking rate.
Per Talkadot's State of the Speaking Industry 2026: (SOSI-001)
| Event Format | Same-Org Rebook Rate | Avg Depth When Rebooked |
|---|---|---|
| Breakout | 10% | 2.4 events |
| Training | 7% | 2.6 events |
| Workshop | 6% | 2.1 events |
| Keynote | 1% | 2.0 events |
Workshops continue into a repeat booking 6 times per 100 relationships, breakouts 10, and training 7, against 1 per 100 for keynotes.
If you only look at fee-per-event, keynotes win. If you look at the lifetime value of a single buyer relationship, the math tightens considerably.
52 Percent of Keynote-Primary Speakers Never Get Rebooked
Among speakers with multiple clients, primarily-keynote speakers are 2x as likely to have zero repeat bookings (52 percent) as primarily-workshop speakers (27 percent). Training-focused speakers: 24 percent zero-repeat. (SOSI-014)
The majority of multi-client keynote-only speakers never get rebooked by the same organization.
That is a signal planners can use before booking, not just after.
The Training Format Goes Deep When It Rebooks
Training events rebook less often than workshops, but when they do, the relationship is stickier: Training averages 2.6 events per rebook relationship vs 2.1 for workshops and 2.0 for keynotes. (SOSI-016)
For L&D planners building a recurring relationship, training format has the highest depth advantage.
Speakers With Rebooks Offer More Formats
The speaker profile associated with repeat bookings is not a mystery. Speakers with repeat bookings are 2.5 times more likely to offer both keynotes and workshops (26 percent vs 11 percent for low-rebook speakers). They offer twice as many event formats on average (1.4 vs 0.7) and serve nearly twice as many buyer segments (0.9 vs 0.5). (SOSI-015)
Format range correlates with relationship depth.
Before booking, ask whether the speaker offers both a keynote and a workshop option. The data says it is a reliable proxy for whether they have delivered repeat value to past clients.
Section 3: Audience Ratings, Response Volume, and What Actually Differentiates
A 99/100 Rating Is Not a Vetting Signal. It Is Table Stakes.
If you have ever hired a speaker who got a glowing rating from the last organization and then failed to deliver for yours, this section explains why that happened.
The average audience rating across Talkadot is 99.1 to 99.4, regardless of fee tier, audience size, or topic.
Three structural reasons: self-selection (audiences who had a mediocre experience tend not to fill out the survey), pre-filtered population (paid professionals have already cleared a quality bar), and in-room recency bias (surveys completed immediately after the session push ratings up). (SOSI-017)
Year-over-year rating movements of less than a point are not meaningful. Fees and ratings move independently.
Audience Response Volume Is the Fee Map
Here is the signal that actually scales with fees. (SOSI-018)
| Audience Responses per Event | Avg Rating | Median Fee |
|---|---|---|
| 1-5 responses | 99.4 | $1,500 |
| 6-15 | 99.4 | $2,000 |
| 16-30 | 99.4 | $3,000 |
| 31-75 | 99.3 | $4,100 |
| 76-150 | 99.3 | $5,000 |
| 150+ | 99.1 | $7,500 |
Source: Talkadot's State of the Speaking Industry 2026
Ratings are virtually identical across every tier. Fees scale 5x from the smallest to the largest audience response tier.
A 99/100 rating from 150 audience members is a fundamentally different signal than the same rating from 5.
When you vet a speaker, the number of audience members who responded to their post-event surveys is the data point that separates the tiers - not the rating itself. On Talkadot, audience response volume is shown on every speaker profile. (SOSI-002)
Section 4: What Audiences Actually Say - Language Patterns That Predict Outcomes
The Word That Predicts Rebooks: "Engaging," Not "Inspiring"
This is the counterintuitive finding.
Audiences of $10K-plus speakers use "inspiring" 50 percent more often than audiences of $2,000 to $3,000 speakers (20.5 percent vs 13.6 percent). (SOSI-021)
So "inspiring" correlates with premium fees.
But it does not correlate with repeat bookings.
Audiences of high-rebook speakers use "engaging" at 15.4 percent vs 12.9 percent for low-rebook speakers. They use "interactive" at 3.6 percent vs 2.2 percent. They use "inspiring" at 13.3 percent - lower than low-rebook speakers (17.5 percent). (SOSI-003, SOSI-022)
The pattern holds even within keynotes only. Rebooked keynote speakers: 16 percent "engaging" vs 13 percent for non-rebooked. 19 percent "inspiring" vs 21 percent.
Read the open-text audience feedback before booking. If you see "inspiring" and "motivating," you are looking at a memorable event. If you see "engaging," "interactive," and "practical," you are looking at a speaker you will probably book again. On Talkadot, verbatim audience feedback is on every speaker profile. Ask to see it before you commit.
AI Audiences Respond Differently Than Every Other Topic
AI speaking has the lowest "inspiring" rate of any major topic category and the highest "tools/strategies" rate. Audiences treat AI talks as informational, not transformational. (SOSI-024)
If your goal is an inspirational keynote that moves people emotionally, AI is the wrong category.
If your goal is skills and frameworks the team can act on Monday, AI may be exactly right.
Corporate Culture Gets the Best Audience Language
Corporate Culture sessions generate the highest rates of "engaging" and "fun" language across all topic categories. (SOSI-025)
The topic audiences enjoy the most also commands the highest median fee on the list of undersupplied niches: $6,000.
Section 5: Buyer Segment Data and the Sales Cycle
The Audience-to-Booking Sales Cycle Runs 4.5 Months on Average
When an audience member first encounters a speaker at someone else's event, the median time before their organization books that same speaker is 4.5 months. The range is wide: weeks to over a year. (SOSI-004)
Most planning cycles sit inside this window.
The practical consequence for planners: the speaker you saw at last year's industry conference is still available to book. The lead is not cold.
Niche Topic-Buyer Intersections with the Highest Ceilings
The general fee benchmarks are the floor. The topic-buyer intersections show where the ceiling actually sits.
From Talkadot's State of the Speaking Industry 2026:
- Sales speaking for SMBs: Sales overall median is $2,500. Sales speakers working with SMBs command an $8,500 median and $20,800 at the 90th percentile. (SOSI-019)
- Communication for Government: Communication overall median is $3,500. Government buyers pay up to $15,850 at the 90th percentile. (SOSI-020)
- Performance Management (any buyer): The $10,000 median is the highest niche fee on the platform. Small category, treat as a directional signal. (SOSI-013)
These are not flukes. They reflect what specialized buyers will pay when they need domain-specific content.
Methodology
Data Source
Talkadot's State of the Speaking Industry 2026 is built on verified Talkadot platform data from January 2023 through March 2026. (SOSI-027)
The dataset covers more than a million verified audience survey responses across tens of thousands of speaking engagements, drawn from a broad cross-section of professional speakers in the United States. (SOSI-026)
There are an estimated 40,000 professional speakers in the US. Talkadot's dataset covers a meaningful share of that market, with a skew toward speakers who actively track their business data. Findings are most reliable for established, growth-oriented professional speakers.
Sample Size Thresholds
Headline findings require at least 50 fee-populated events across 20 or more speakers. Standalone topic or segment claims require at least 30 events. Cross-tabulations require at least 20 events and are labeled as directional signals. (SOSI-028)
What the Data Covers Confidently
- Fee band distributions and medians (large, representative sample)
- Topic demand shares (thousands of topic-tagged events)
- Rebook rates by event format (hundreds of speaker-organization pairs)
- The rating-fee ceiling effect
- Audience language patterns by fee tier and rebook status
Directional Findings (Smaller Samples)
- Year-over-year growth rates (platform adoption inflates early trends)
- Demographic segment growth
- Topic x Buyer intersections when cross-tabbed to small samples
- Audience-to-booking conversion timelines
- Language pattern to rebook causation (correlation, not causation)
Data Hygiene
A small number of clearly erroneous fee entries were identified and excluded (data entry errors in the millions, obvious decimal-point mistakes). All fee analysis uses a per-event ceiling. All data is anonymized and aggregated. No individual speaker names, fees, or client relationships are disclosed.
What This Data Cannot Yet Answer
- Fee differences by gender, race, or identity (voluntary data; pool not yet representative)
- Geographic variation (no event location data)
- How first-time buyers behave vs repeat buyers
- Whether speakers' listed asking rates match their actual closing rates
What This Means If You Are Booking a Speaker Right Now
Six things the data would suggest before your next booking.
- Anchor to your segment median, not the overall median. A corporate planner at $4,500 median and a higher education planner at $2,200 median are buying different markets.
- Ask for audience response volume, not a rating. You want 30 to 50 responses per recent event, ideally 150 or more. Ratings tell you nothing. On Talkadot, audience response volume is shown on every speaker profile.
- Read the open-text feedback. Look for "engaging" and "interactive." Weight those above "inspiring" if you want a speaker you will book again. On Talkadot, verbatim audience feedback is available on every profile - use it.
- Ask about format options. A speaker who offers a keynote plus workshop package is 2.5x more likely to have been rebooked by past clients. That is not a coincidence.
- Check for repeat-booking history. 52 percent of keynote-primary speakers with multiple clients have zero repeat bookings from the same organization. If the speaker has been around for years and no organization has come back, that is data.
- Start early. The median audience-to-booking cycle is 4.5 months. Four months before your event is not early.
Talkadot is free for event planners. Find proven speakers - with verified audience feedback - at talkadot.com/find-a-speaker.
Speaker Industry Data and Trends 2026: FAQ
What is the median speaker fee in 2026?
According to Talkadot's State of the Speaking Industry 2026, the median professional speaker fee is $2,500. The 25th percentile is $1,000, the 75th percentile is $5,000, and the 90th percentile is $10,000. These benchmarks have been identical since 2023. The $20K-plus tier represents a stable 5 percent of fee-logging speakers and has not grown in three years.
How much does a keynote speaker cost for a corporate event?
For corporate buyers, Talkadot platform data shows a $4,500 median speaker fee. That is meaningfully above the platform-wide median of $2,500 because corporate buyers have larger budgets and more specific outcomes. If a bureau quotes significantly above this range, the data says comparable talent exists within range - with audience feedback to verify it.
What percentage of speakers get rebooked by the same organization?
Rebooking rates depend heavily on event format. Workshop speakers see a 6 percent same-organization rebook rate. Training speakers see 7 percent. Breakout speakers see 10 percent. Keynote speakers see 1 percent. Among primarily-keynote speakers with multiple clients, 52 percent have zero repeat bookings. The rebook signal is one of the strongest quality indicators in Talkadot's dataset.
Are speaker ratings reliable for vetting?
No. The average audience rating across Talkadot's platform is 99 out of 100, and ratings cluster at 99-plus regardless of fee tier or audience size. Ratings compress for three reasons: self-selection bias (unhappy audiences skip the survey), pre-filtered population (paid speakers have cleared a quality bar already), and in-room recency bias (surveys completed immediately after the session). Audience response volume - how many people filled out the survey - is the signal that actually scales with fees.
What speaker topics pay the most in 2026?
According to Talkadot's State of the Speaking Industry 2026, the highest-fee niches by median are: Performance Management ($10,000 median, small sample), Corporate Culture ($6,000), Change Management (above $5,000 with corporate buyers), and Leadership sub-tags labeled "Leadership Development," "Inclusive Leadership," "Team Leadership," or "Strategic Leadership" (all at $5,000 median). For specific buyer-topic intersections, Sales speaking for SMBs commands an $8,500 median and Government Communication reaches $15,850 at the 90th percentile.
What is the data source for these speaker industry statistics?
All statistics on this page are from Talkadot's State of the Speaking Industry 2026. The report is built on more than a million verified audience survey responses across tens of thousands of speaking engagements, covering professional speakers across the United States. The data covers January 2023 through March 2026. Every headline finding meets a sample-size threshold: 50 or more fee-populated events across 20 or more speakers. Cross-tabulations at smaller samples are labeled directional.
How does audience language in post-event surveys predict speaker performance?
Talkadot's word-frequency analysis across more than a million audience survey responses found that audiences of high-rebook speakers use "engaging" 15.4 percent of the time vs 12.9 percent for low-rebook speakers, and "inspiring" 13.3 percent vs 17.5 percent. The pattern holds even within keynotes only. "Inspiring" correlates with premium fees but not with repeat bookings. "Engaging" and "interactive" correlate with return engagements. Before booking a speaker, ask to see verbatim audience feedback - then read it for those words.
Related Resources
If you are ready to apply this data to a real speaker search, these pages walk through the mechanics.
- How much does a keynote speaker cost in 2026?. The full fee benchmark breakdown with segment and topic cross-tabs.
- How to find a keynote speaker for a corporate event. The 5-step vetting flow built on this dataset.
- What is a speaker marketplace?. How data-driven marketplaces differ from traditional bureaus.
Talkadot is free for event planners. Find proven speakers - with verified audience feedback - at talkadot.com/find-a-speaker.
Published: 2026-06-16. Author: Arel Moodie, cofounder, Talkadot. Data source: Talkadot's State of the Speaking Industry 2026, based on more than a million verified audience survey responses across tens of thousands of speaking engagements (January 2023 through March 2026).